Project Completion
Projects
Estimates
Git
Tickets
18
See project completion trajectory and recent project performance vs. due dates.

This report shows you whether current projects are on track and how recent projects performed vs. their due dates.
The first chart shows the number of epics that are estimated to be ahead or behind schedule based on their due dates and recently completed story point count.
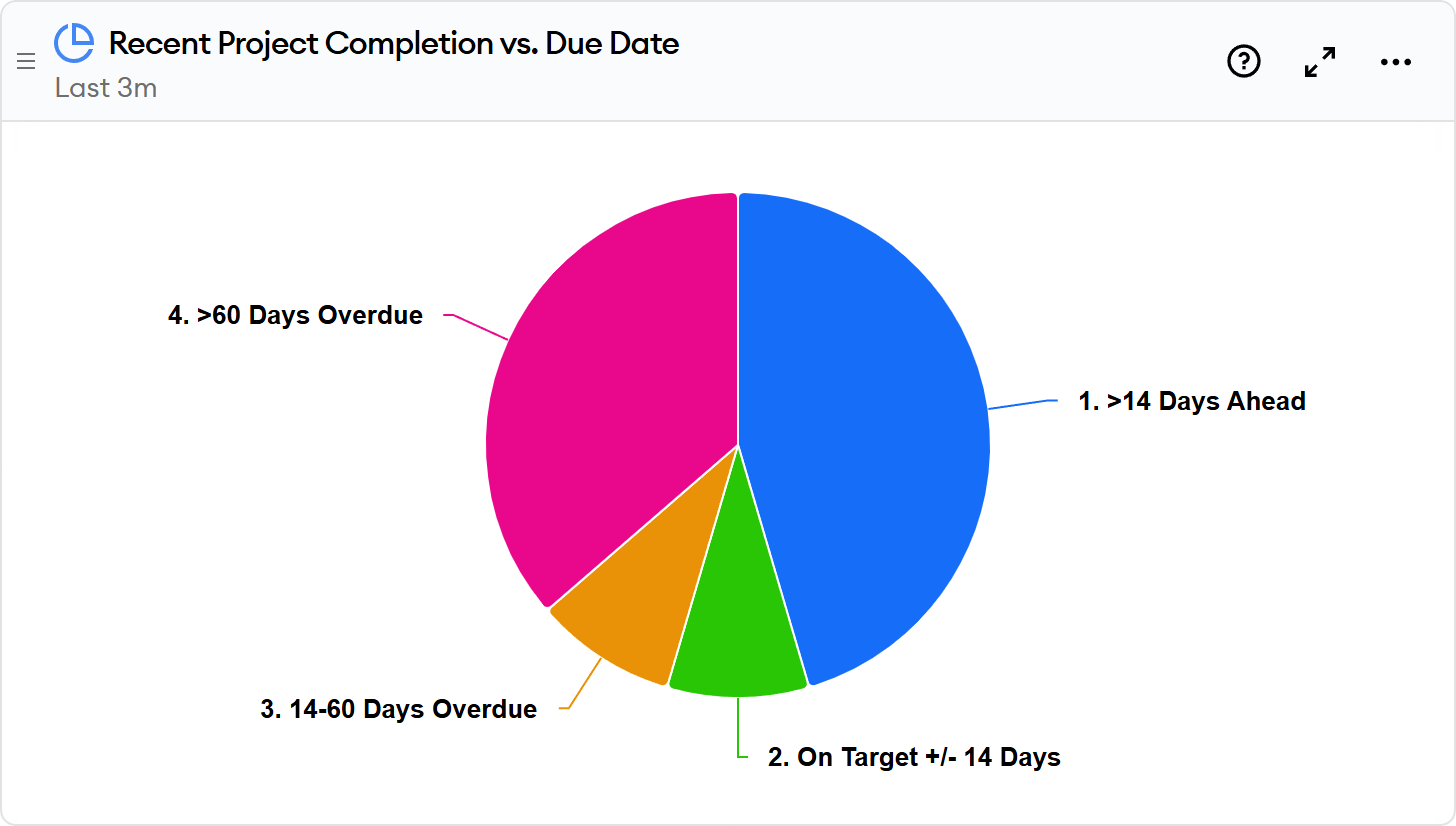
The next chart summarizes completion time vs. due date for recently completed epics.
The chart then shows a list of all epics with recent activity, as well as all recently completed epics. Clicking on the detail link for each chart takes you to the Project Completion Detail report, which contains the following additional information:
- A burn-up chart of total epic scope and completed points over time.
- A line chart of velocity and scope changes for tickets in the epic.
- An area chart of Active work effort on tickets in the in an epic, which lets you see whether people are working on tickets assigned to the epic.
- An in-progress ticket count chart, which can help identify tickets that are stuck or taking longer than they should.
- A list of all tickets in the epic that have been completed, grouped by sprint in which they were completed (if any).
- A list of tickets in the epic that are incomplete.