Report Template Library
Browse reports that top engineering leaders use to manage their teams. You can add each report to your minware account and customize it for your organization, or schedule a demo to see it in action.
Most Popular

Capitalization
KPIs
Git
Tickets
96
Code/Ticket Hygiene and Traceability
Track how consistently teams follow best practices for version control and ticketing to provide traceability for reporting.

Agile
Scrum
Tickets
26
Sprint Completion Trends
View trends for points completed vs. sprint commitment by team and individual.

Costs
Projects
Tickets
209
Project Cost Allocation
View time spent on each project to see where your development costs are being allocated.

Bugs
Quality
KPIs
Tickets
12
Bug Management
Track how consistently teams manage bugs and their overall bug fixing load.

Compliance
Change Control
KPIs
Git
13
Change Control Compliance
View the percentage of time where work is done in compliance with change control best practices.

Agile
Scrum
Estimates
Tickets
353
Sprint Best Practices
View information about how well your team follows best practices related to running sprints.

Workflow
Epics
Git
Tickets
48
Work Batch Sizes
View information about the overly large tickets, branches, and epics, which can impact development efficiency.

Workflow
Overhead
Git
Tickets
11
Context Switching
Understand how focused your development activities are.

KPIs
Workflow
Overhead
Git
36
Inspired by Uber's Dashboard
See how your team performs on Uber's engineering dashboard metrics.

Kanban
KPIs
Agile
Tickets
13
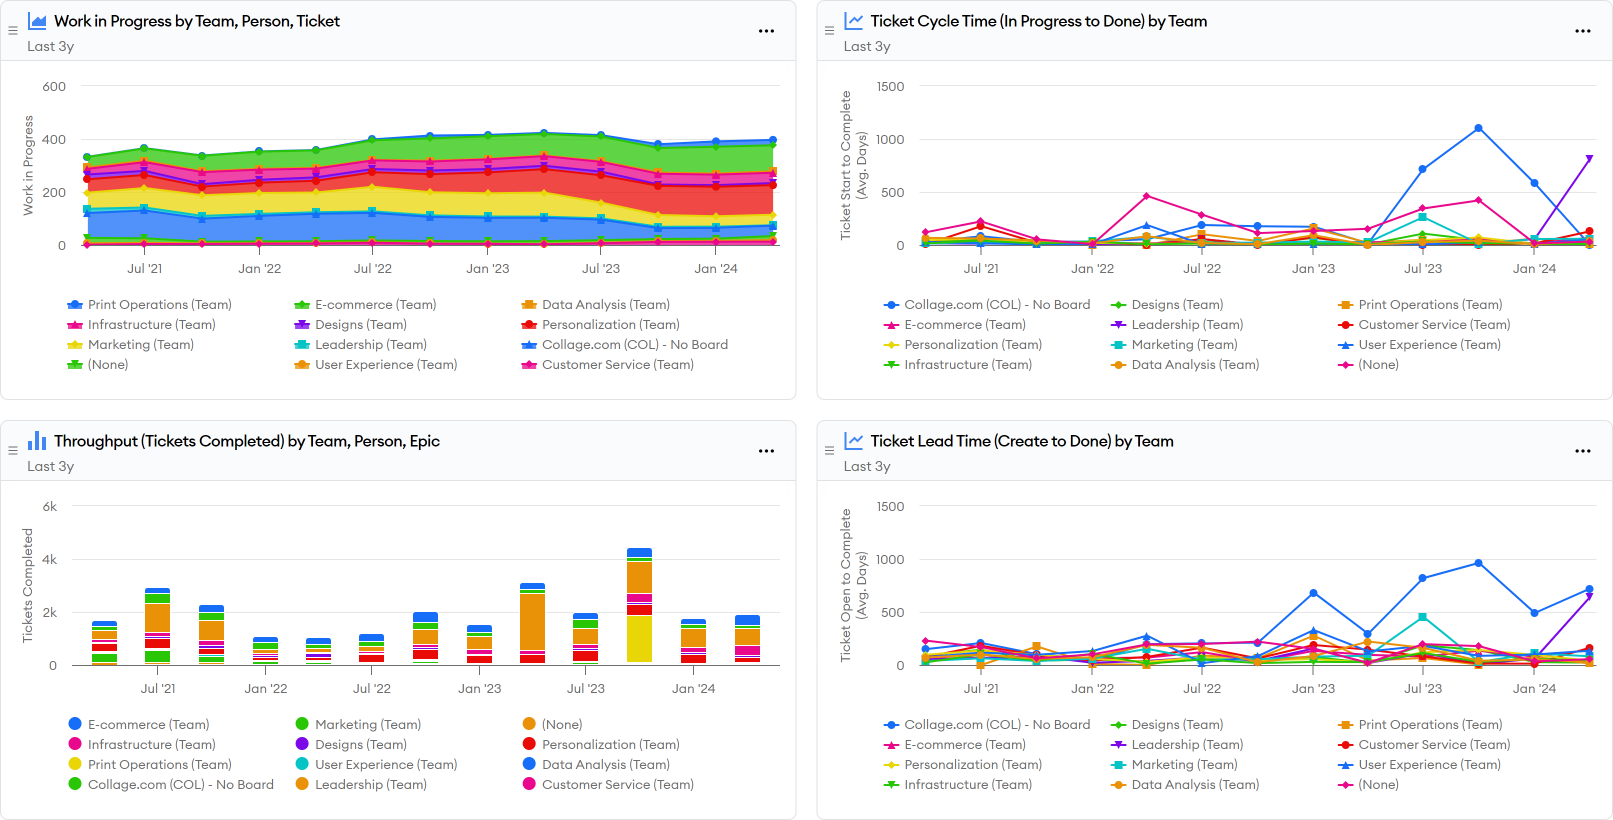
Kanban Esssentials
Track essential kanban productivity metrics related to throughput, work in progress, and cycle/lead time.

Bugs
Quality
KPIs
Tickets
19
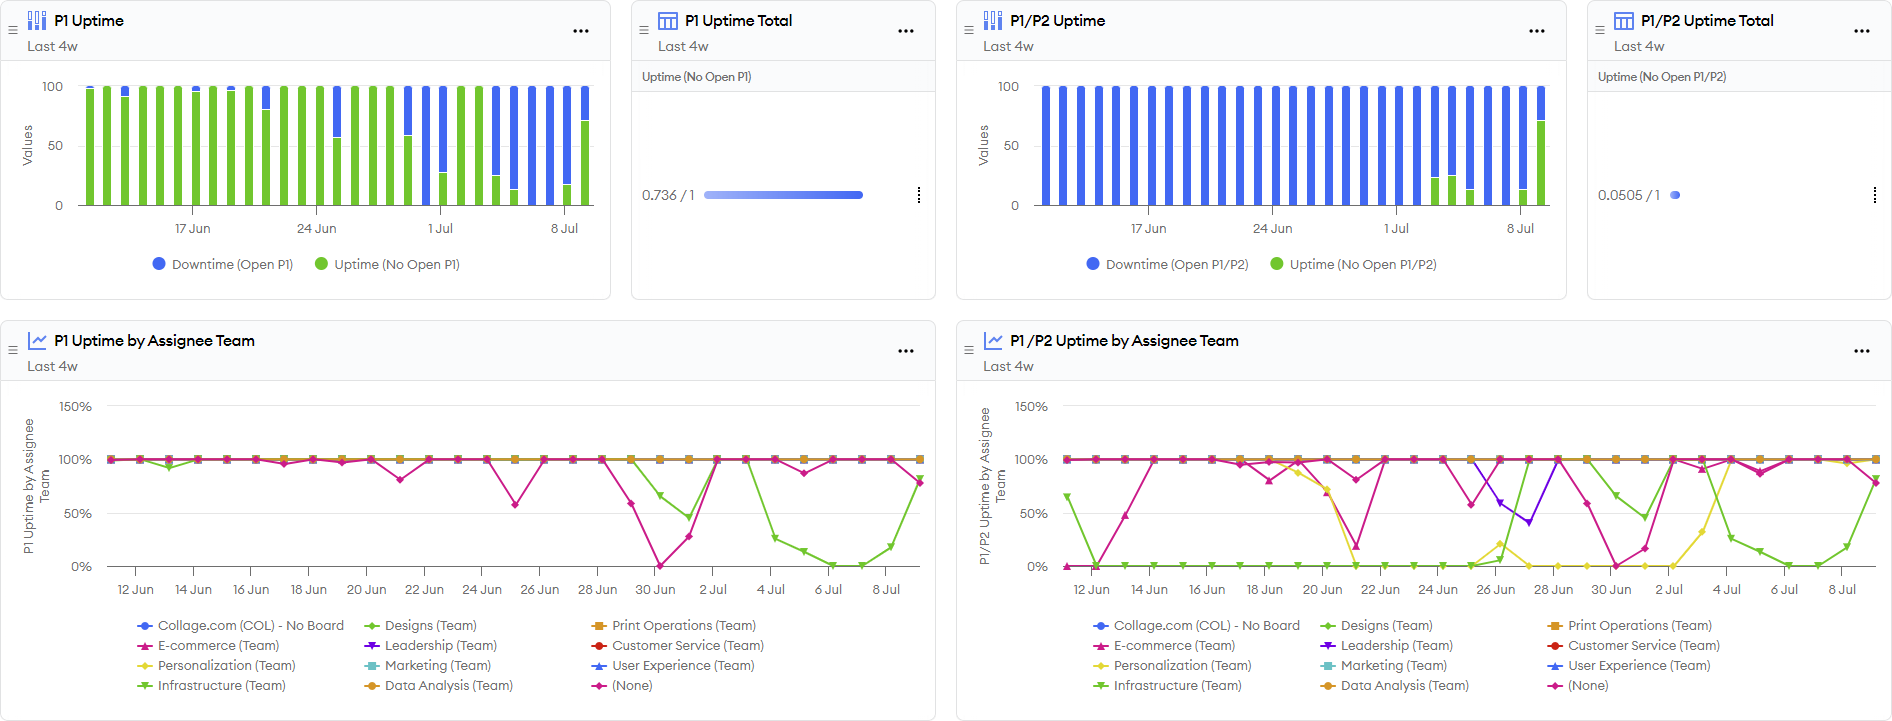
Uptime Dashboard
Monitor time with open high-priority issues by team and ticket.

Workflow
KPIs
Git
Tickets
45
DORA Metrics
Track the four classic DORA metrics plus ticket lead time.

Projects
Estimates
Git
Tickets
18
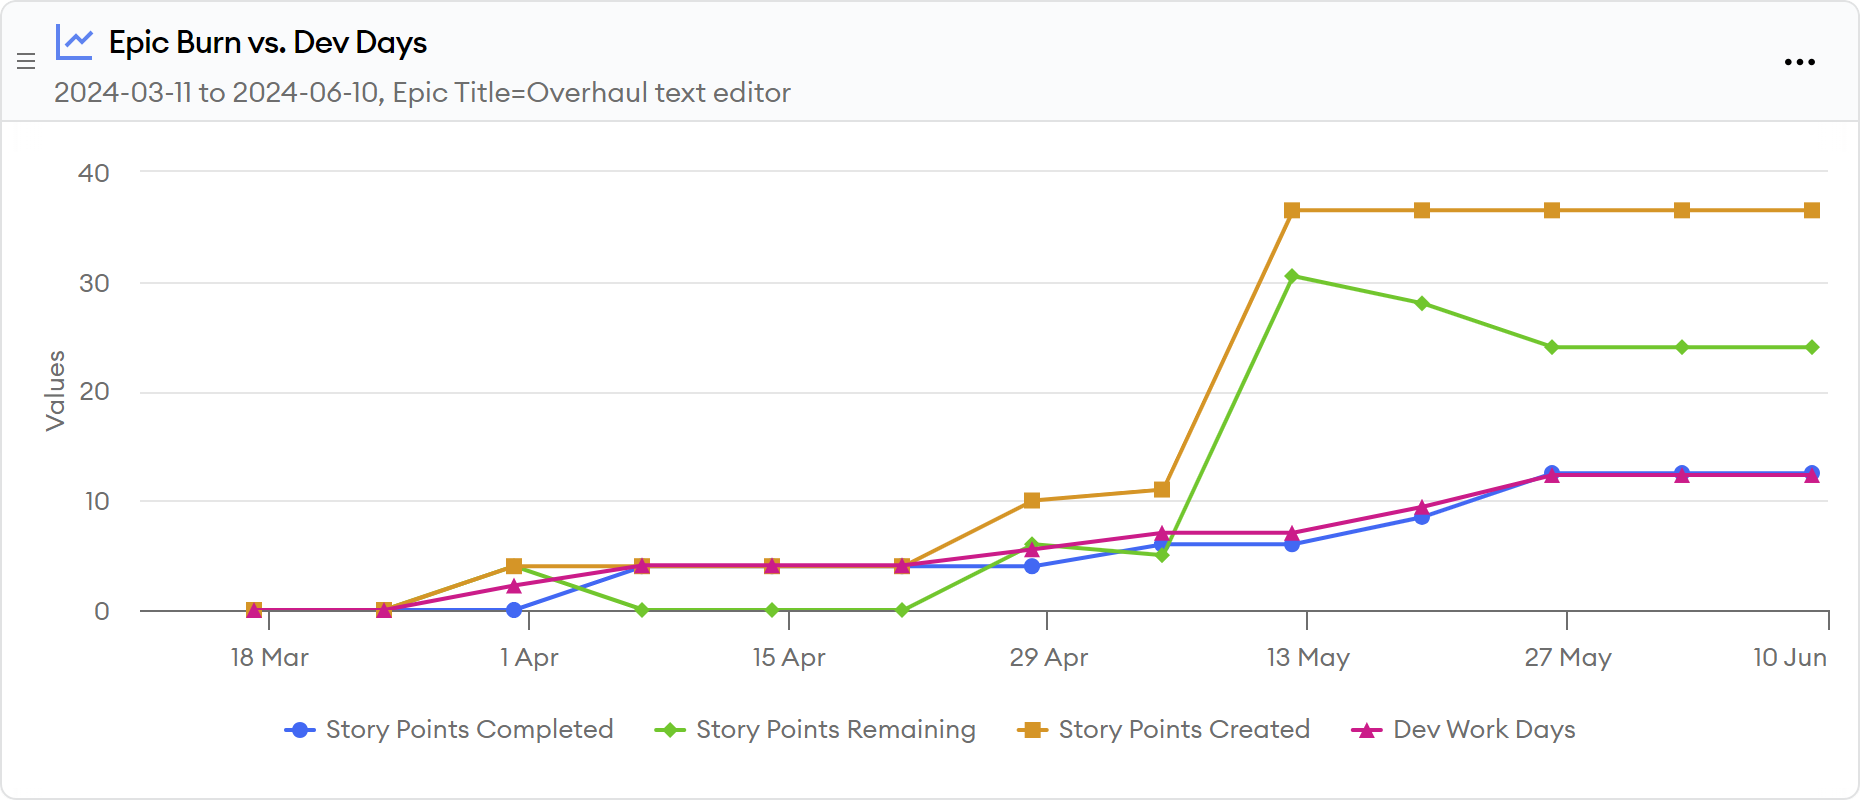
Project Completion Tracker
See project completion trajectory at a glance with story point burndown, scope creep, and dev effort in one place.

Utility
Git
Tickets
22
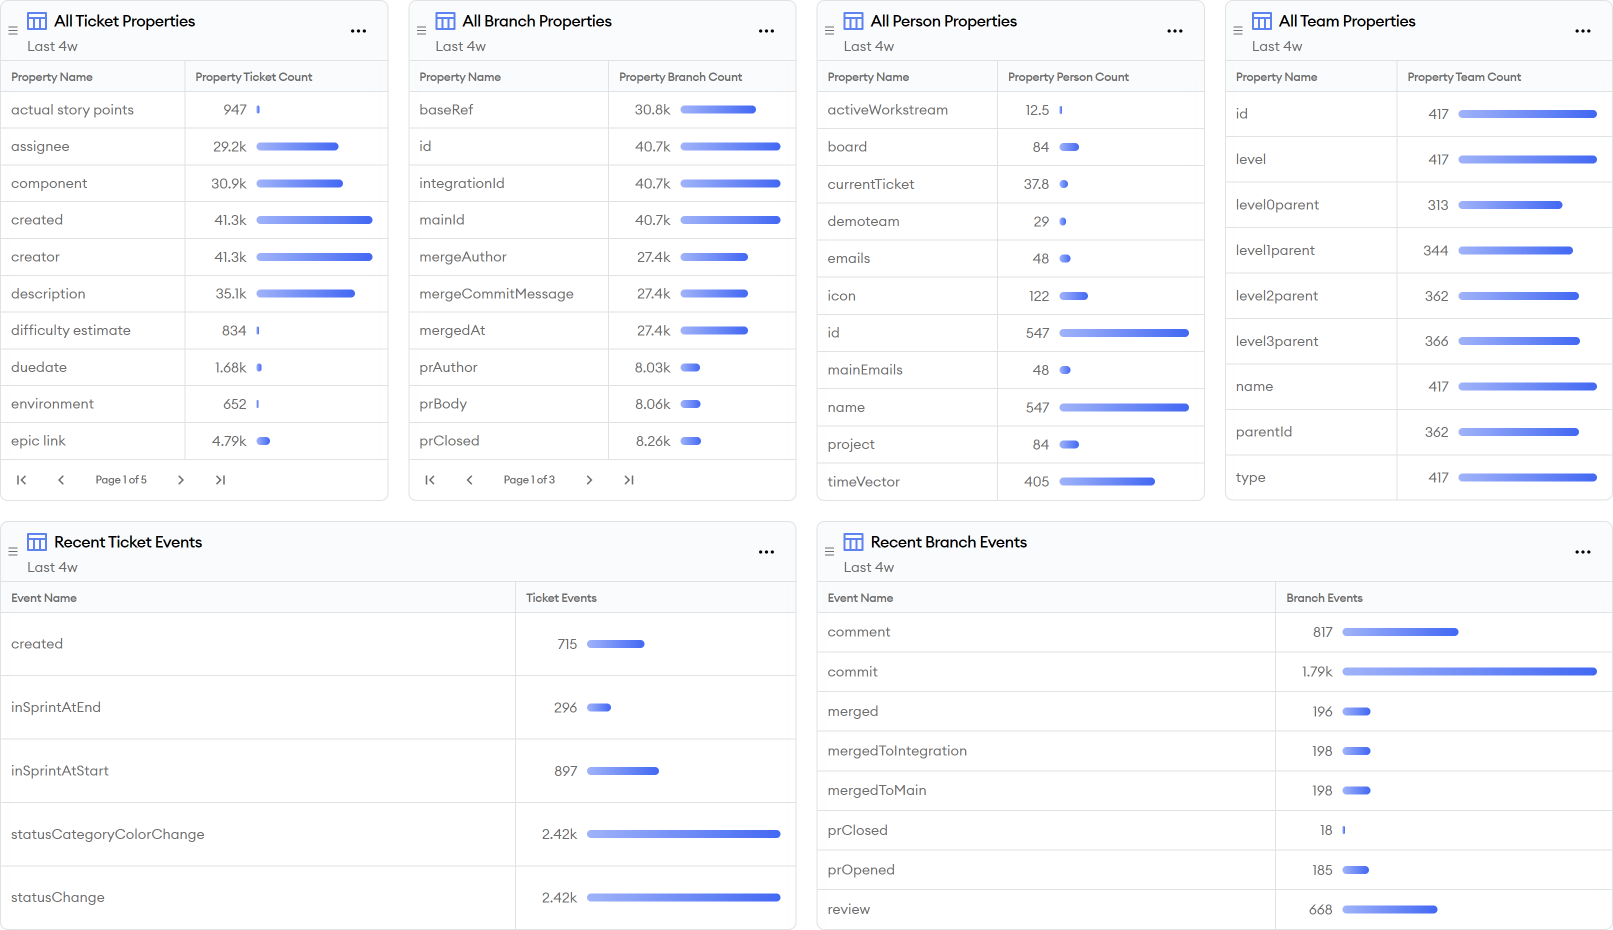
minQL Property Reference
See all of the properties and events available in minQL for your organization and inspect their values.

Costs
Overhead
Agile
Tickets
15
Interruption Cost
Calculate the cost of sprint and ticket interruptions broken down by team, sprint, and ticket priority.

Bugs
Quality
KPIs
Tickets
30
Bug SLA Resolution
Track your bug SLA resolution (BSLAR) metric and see the longest open bugs.

Quality
Workflow
CI/CD
23
CI/CD Pipeline Performance
View information about the performance and reliability of your CI/CD pipelines.

Bugs
Tech Debt
Costs
Tickets
19
Tech Debt Measurement
Track time spent on bugs and estimate misses, the two main manifestations of technical debt.

Projects
Epics
Git
Tickets
46
Individual Contributions
See all of the code, ticket, and review contributions of an individual at a glance.

Meetings
Calendar
Overhead
11
Meeting Management
Gain insights into the time spent in meetings and out of office to help your teams operate effectively.

Workflow
KPIs
CI/CD
Git
29
Deployments and Throughput
View the rate of deployments, pull requests, and coding work flowing through the software development process.

Bugs
Quality
KPIs
Tickets
20
MTTR/Bug Resolution Time
Keep track of how quickly outages and bugs of different priority levels are resolved and open bug backlog size.

Bugs
KPIs
Git
Tickets
33
CFR/Bug Creation
Monitor how frequently changes cause high-severity bugs along with your team’s overall rate of bug creation and bug backlog growth.

Workflow
KPIs
Git
Tickets
51
Lead/Cycle Time and Workflow
Keep tabs on workflow efficiency and total start-to-finish time for pull requests and tickets by stage.

Code Reviews
Quality
KPIs
Git
12
Code Review Practices
Track the consistency and thoroughness of code reviews, as well as the time it takes to receive a review.

Workflow
Tickets
19
Ticket Status Workflow
Investigate how work flows between different ticket statuses, where the most time is spent, and unexpected status bounce-backs.

Code Reviews
Quality
KPIs
Git
14
Merge Success Comparison
See much time engineers spend on successfully merged code compared to other members of the team and organization.

Git
Tickets
Capitalization
Overhead
44
Cost Capitalization
See your capitalizable work per team, contributor, project and more.
Didn’t find what you were looking for?
minware is a flexible, extensible data platform, so almost any report you can dream (based on development data) is possible, and we are constantly adding new reports to the library.
If you have an idea for something you’d like to see, drop us a note and we’ll show you how to do it with minware’s custom report builder.