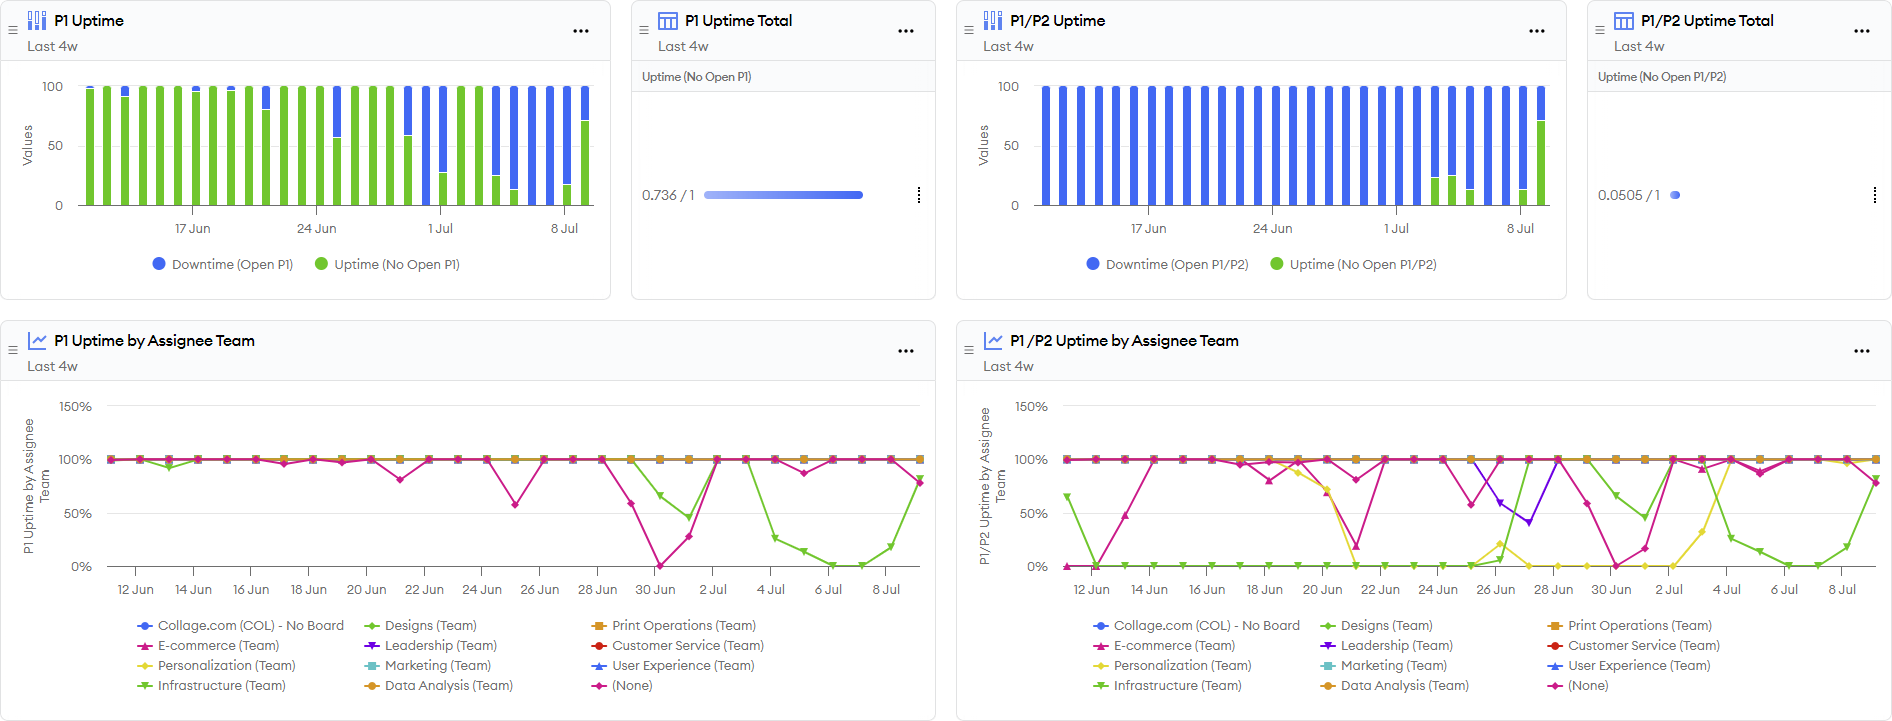
Uptime Dashboard

The uptime dashboard tracks time spent with open high-priority issues. It provides metrics showing both the highest priority (e.g., P1) and a second-tier high priority (e.g., P2).
The dashboard helps you visualize issues that cause downtime by team, issue type and ticket, including a breakdown of how long each high-priority ticket was open.
This report helps you monitor the impact of quality problems across a complex organization with multiple teams and track how well you are doing in one central dashboard.
Uptime and downtime metrics are essential KPIs for ensuring that your teams avoid quality problems with strong test automation, and are able to fix them quickly once they arise.
The difference between this report and what you might see in a system like PagerDuty, OpsGenie, or AWS CloudWatch is that it tracks outages at the ticket level based on data from Jira or other ticketing systems.
Oftentimes non-ticket uptime metrics don’t capture the full scope of outages since they may start prior to alarms going off, or not be fully resolved until tickets are marked done, which can happen after alarms subside.
Organizations also sometimes have high-priority issues that don’t trip any alarms at all, which makes a ticket-based uptime dashboard critical for comprehensive observability.