Sprint Insights
minware’s other high-level reports like Project Cost Allocation and the Scorecard help you see how your organization is doing overall from the top down, but are necessarily limited in their detail.
The sprint insights report, on the other hand, is designed to show you absolutely everything you need to know about work in a particular sprint so that teams can bring the full power of minware to bear to identify issues and assess their root cause during retrospectives.
As such, the sprint insights report has several sections that help you understand the sprint from different viewpoints. Here we will look at what you can glean from the main sections.
Ticket Summary
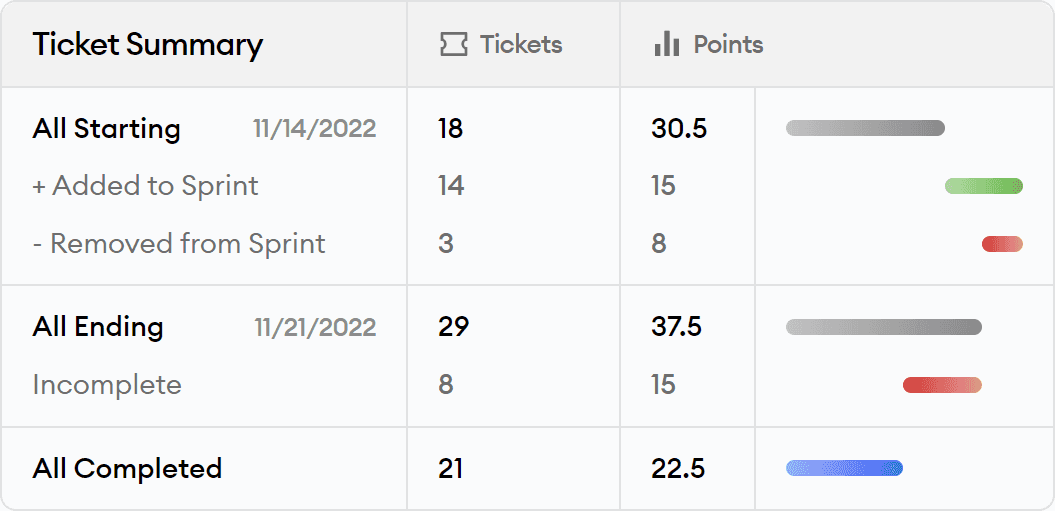
The first section in the sprint insights report is the ticket summary, which shows you the total number of points (or original time estimate units) and tickets at each stage of the sprint:
These are the headline numbers for the sprint, and they are calculated the same way as they are in Jira, with a few small differences. First, we use a default of 1 point for tickets without estimates so they are represented in the analysis (0 point tickets are counted as zero). Also, we provide a bit of leeway by treating tickets added within an hour of the sprint start as being in at the beginning.
Estimate Analysis
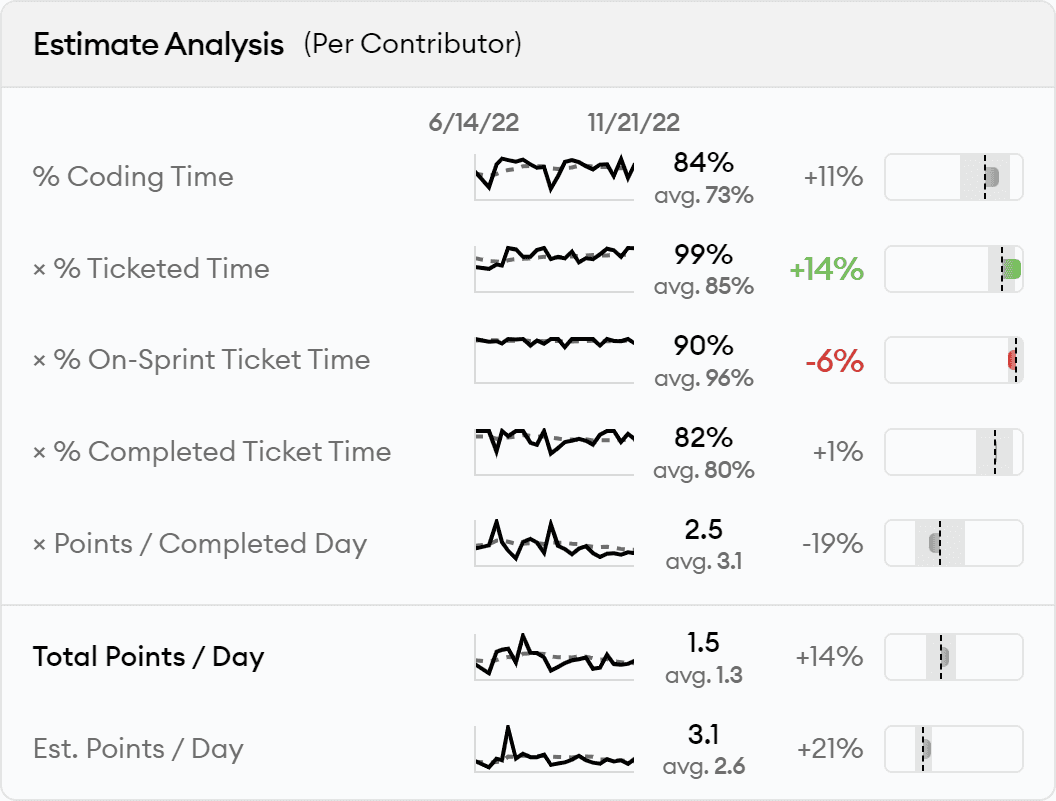
The next section in the header shows an aggregate analysis of how time was spent during the sprint relative to estimates, which you can see in this screen shot:
When you analyze sprint completion, it’s helpful to isolate the different reasons why a sprint was not completed to better assess the root cause. This view essentially peels off each layer of under-the-radar time loss with a graph of historical values for the team:
- Coding Time - What portion of time did the team spend on any type of coding?
- Ticketed Time - What portion of the available coding time was ticketed?
- On-Sprint Ticket Time - What portion of ticketed time was related to tickets in this sprint?
- Completed Ticket Time - What portion of on-sprint ticket time went toward tickets that were completed?
After excluding time not in these buckets, we compare points to time spent on completed tickets so you can see how estimates themselves compare to historical trends. This makes it clear whether sprint completion was impacted by inaccurate estimates, or simply differences in available time.
Finally, we show the points / day after adding back in these sources of time loss, and compare that to both the original commitment and historical trends so you can determine how well your sprint commitment accounts for under-the-radar work.
Flow Efficiency Summary
The next section provides insight into your aggregate flow efficiency, as seen here:
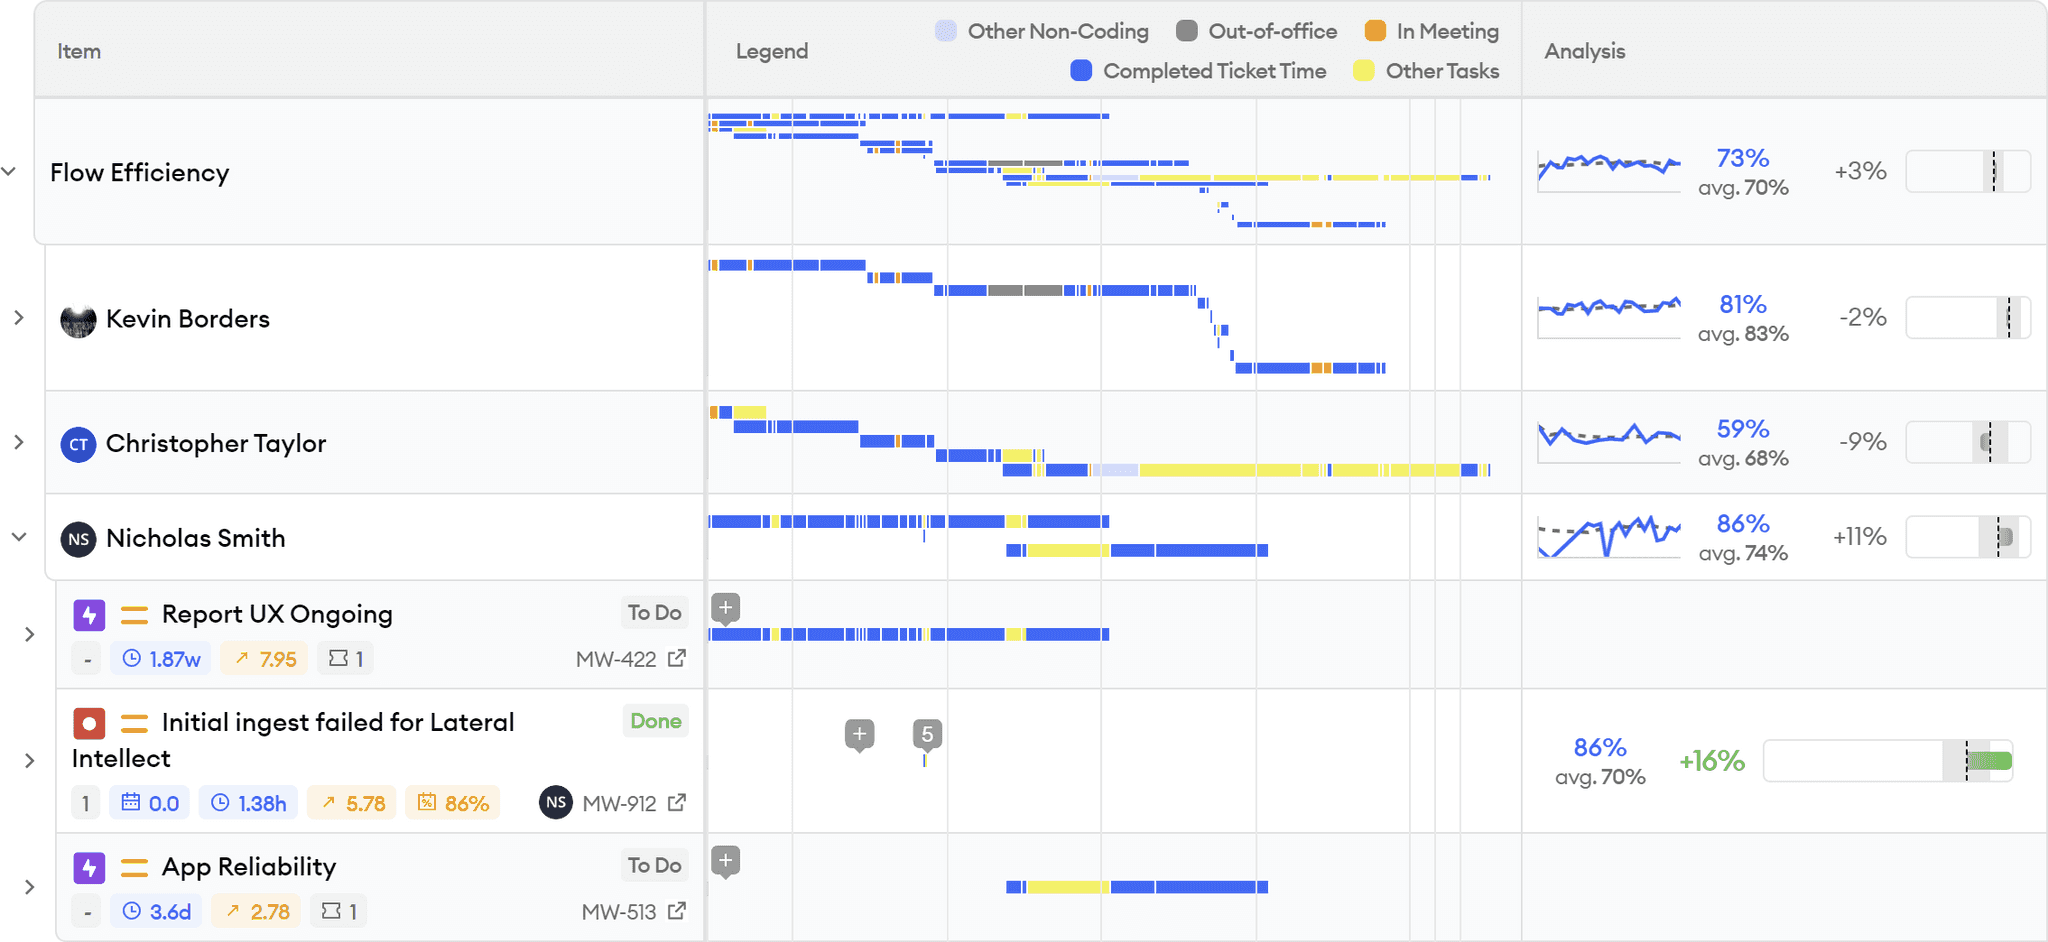
Flow efficiency is defined as the percentage of time that is spent actively working on a ticket from start to finish. Here we compute flow efficiency based on commits, meaning that we only look at time between the first and last commit and count context switching as having meetings or commits that are not tied to the ticket. It is also computed separately for each person’s commit stream on the ticket, so it can still be 100% if someone jumps in mid-way, as long as they don’t context switch during their work on the ticket.
Flow efficiency is a really valuable metric because it helps expose overhead from context switching, which can be caused by several important issues like overly large tickets, inadequate specifications, slow code review, slow tooling, or external dependencies.
Notifications
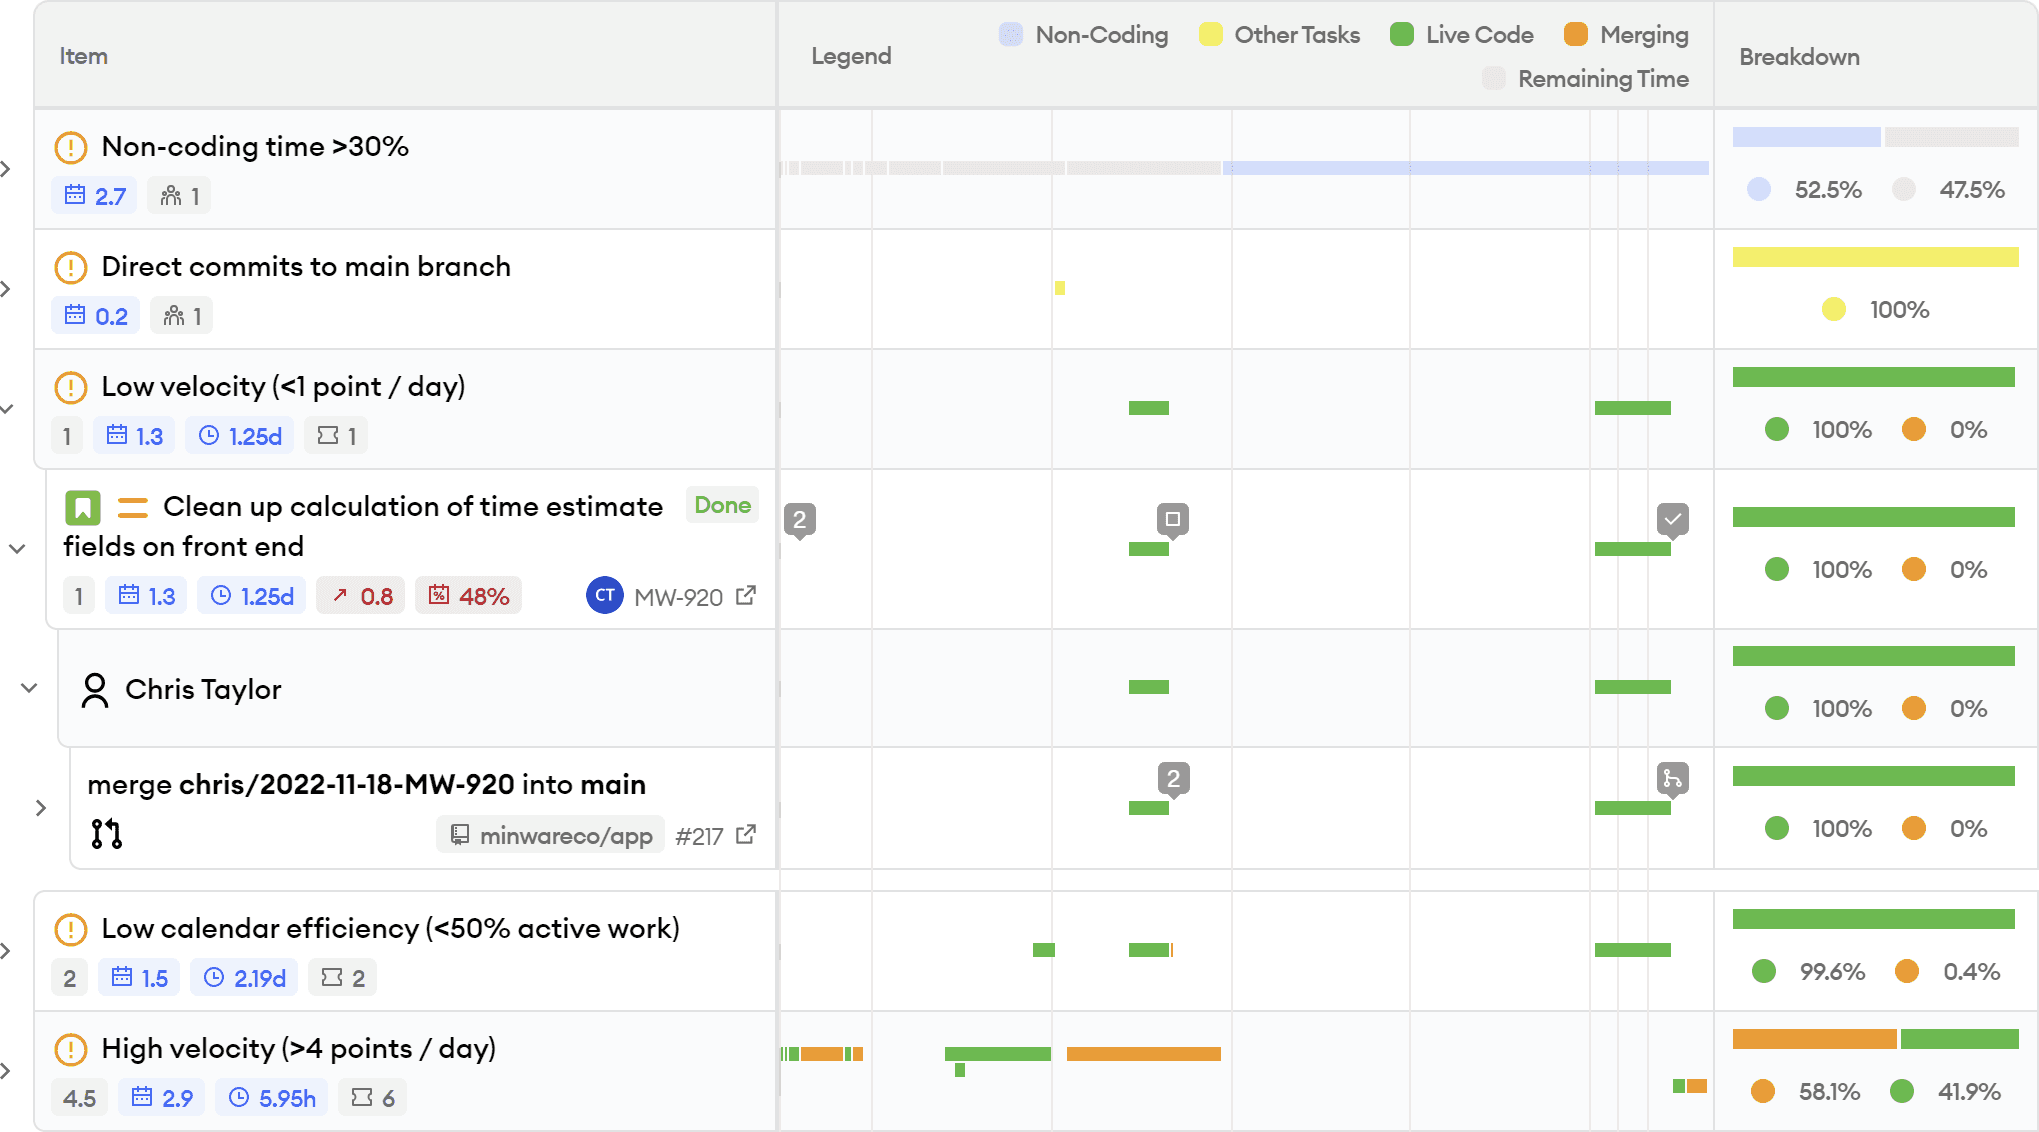
The first section in the sprint insights report body provides a detailed timeline of activity for tickets and other items that are not passing certain scorecard checks, as seen in this screen shot:
The notifications section helps by extracting specific items that warrant discussion during a sprint retrospective, grouped by the type of issue.
The screen shot above also shows how you can drill down into specific tickets, branches, and even commits to see when time was spent on those items, as well as helpful workflow events like ticket status changes, code reviews, and pull request merges, giving the full context necessary to diagnose issues.
Other Activity Time
The next section shows a detailed timeline of time lost at each of the layers described above in the Estimate Analysis section: non-coding, unticketed coding, off-sprint, and incomplete tasks, which you can see in this screen shot:
This section is designed to drill down into specific activities unrelated to sprint ticket completion that show up in the Estimate Analysis summary so that you can determine their root cause.
Each layer excludes activity that was lost from the previous layer so you can more easily isolate different activities.
When you expand the timelines in this section, you can also see the historical averages per person so that it’s easier to tell whether the level of non-sprint activity is out of the ordinary and assess long-term trends.
Ticket Estimate Analysis
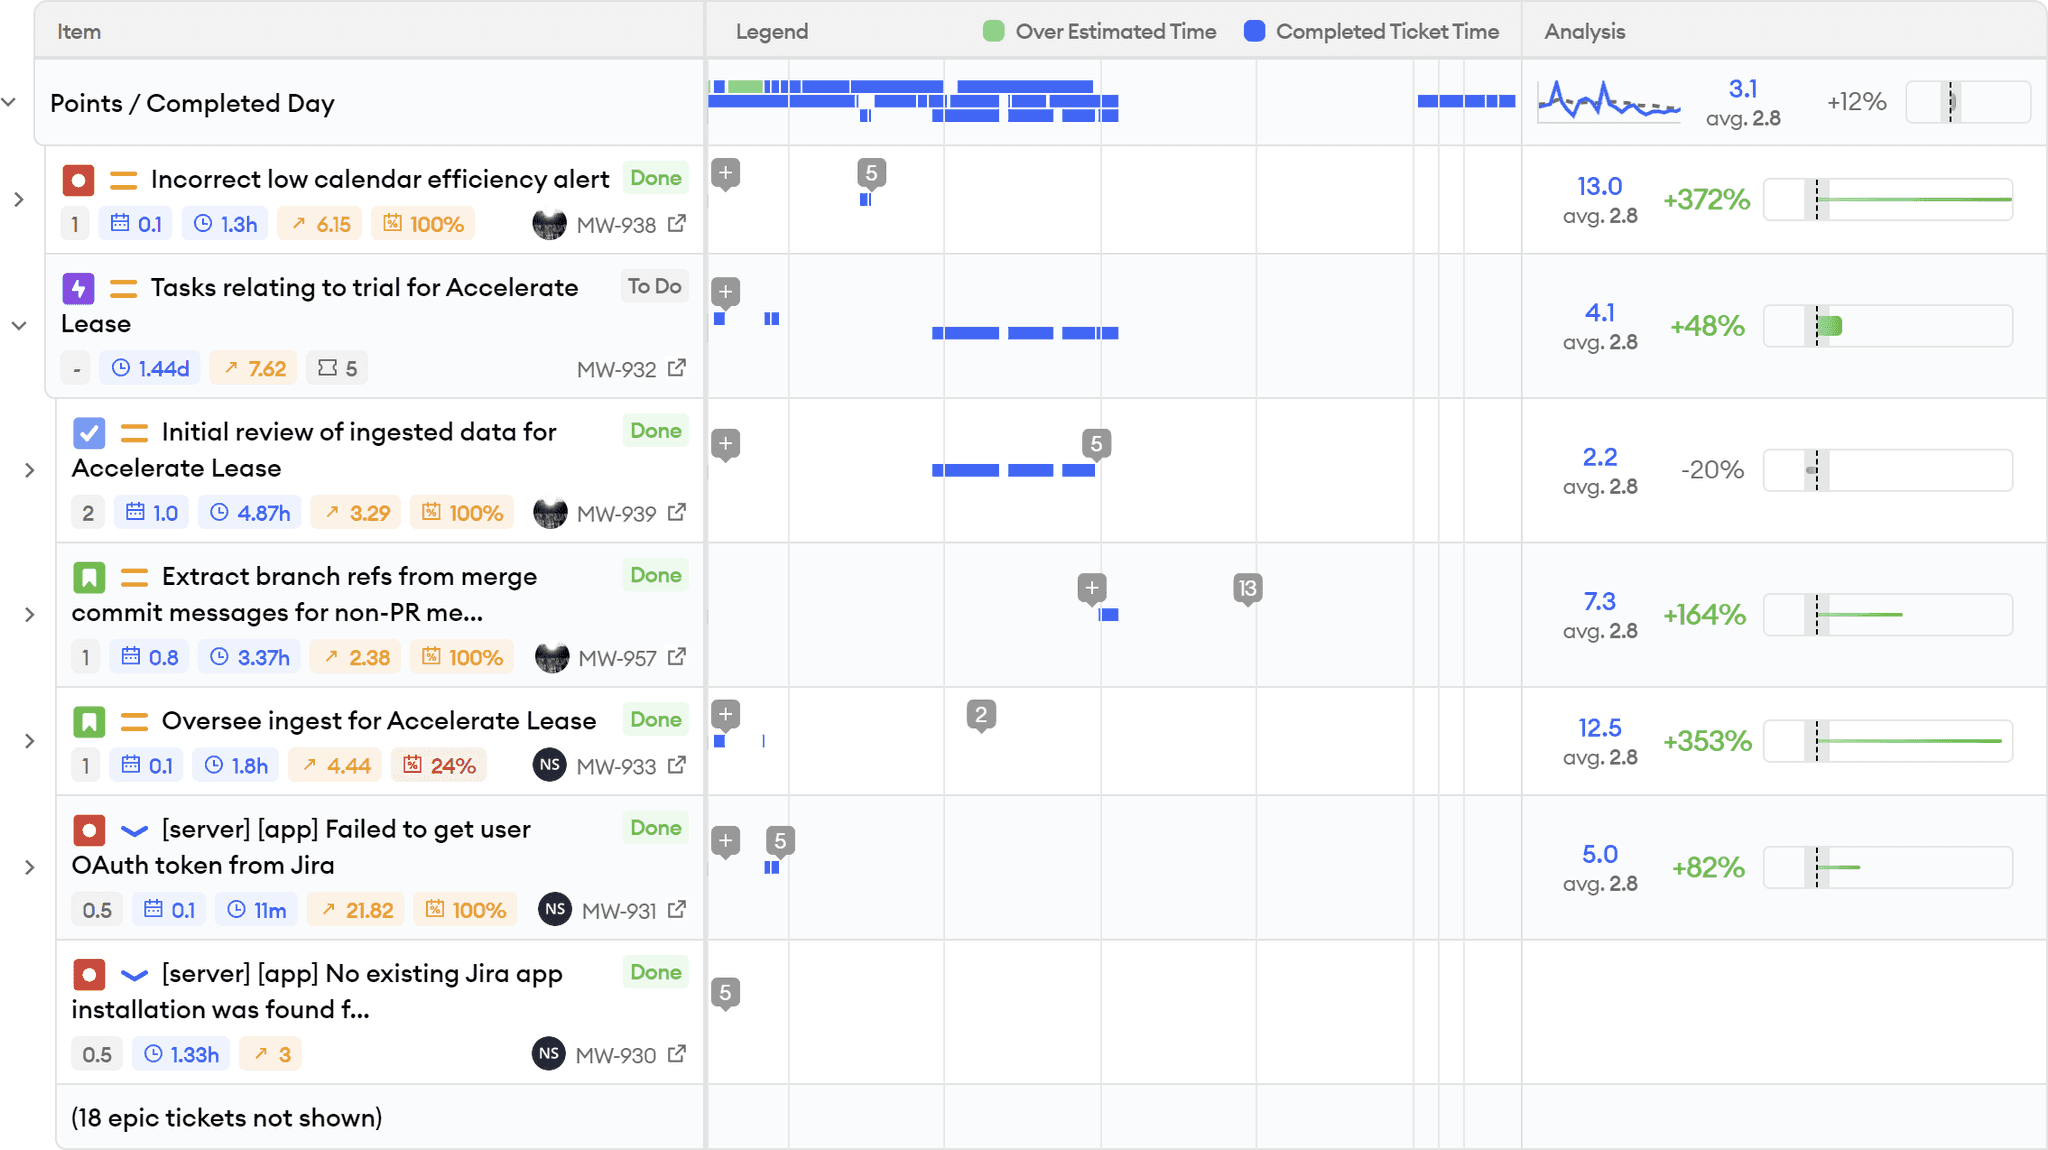
The Ticket Estimate Analysis section excludes time spent on non-sprint activities, just leaving the time dedicated to tasks that were completed by the end of the sprint. If you expand the timeline as shown in this screen shot, you can see the effort that went into each ticket, alongside its point estimate and points / dev day calculation:
This is where you can directly assess which tickets took the longest relative to their estimates and drill down into individual ticket, pull request, and commit activity to assess the root cause of estimate overruns.
Flow Efficiency Detail
The Flow Efficiency section in the main body of the report helps visualize context switching associated with each person and ticket, which is described above in the Flow Efficiency Summary section. This screen shot shows the detailed flow of work in the sprint:
Under each person, there is a row for each ticket they worked on during the sprint, with active work time in blue. Here you can observe exactly how context switching occurred between tickets. By expanding down to pull requests, you can get further details about when pull requests were open, when reviews were received, and how this may have impacted context switching.
Ticket Flow
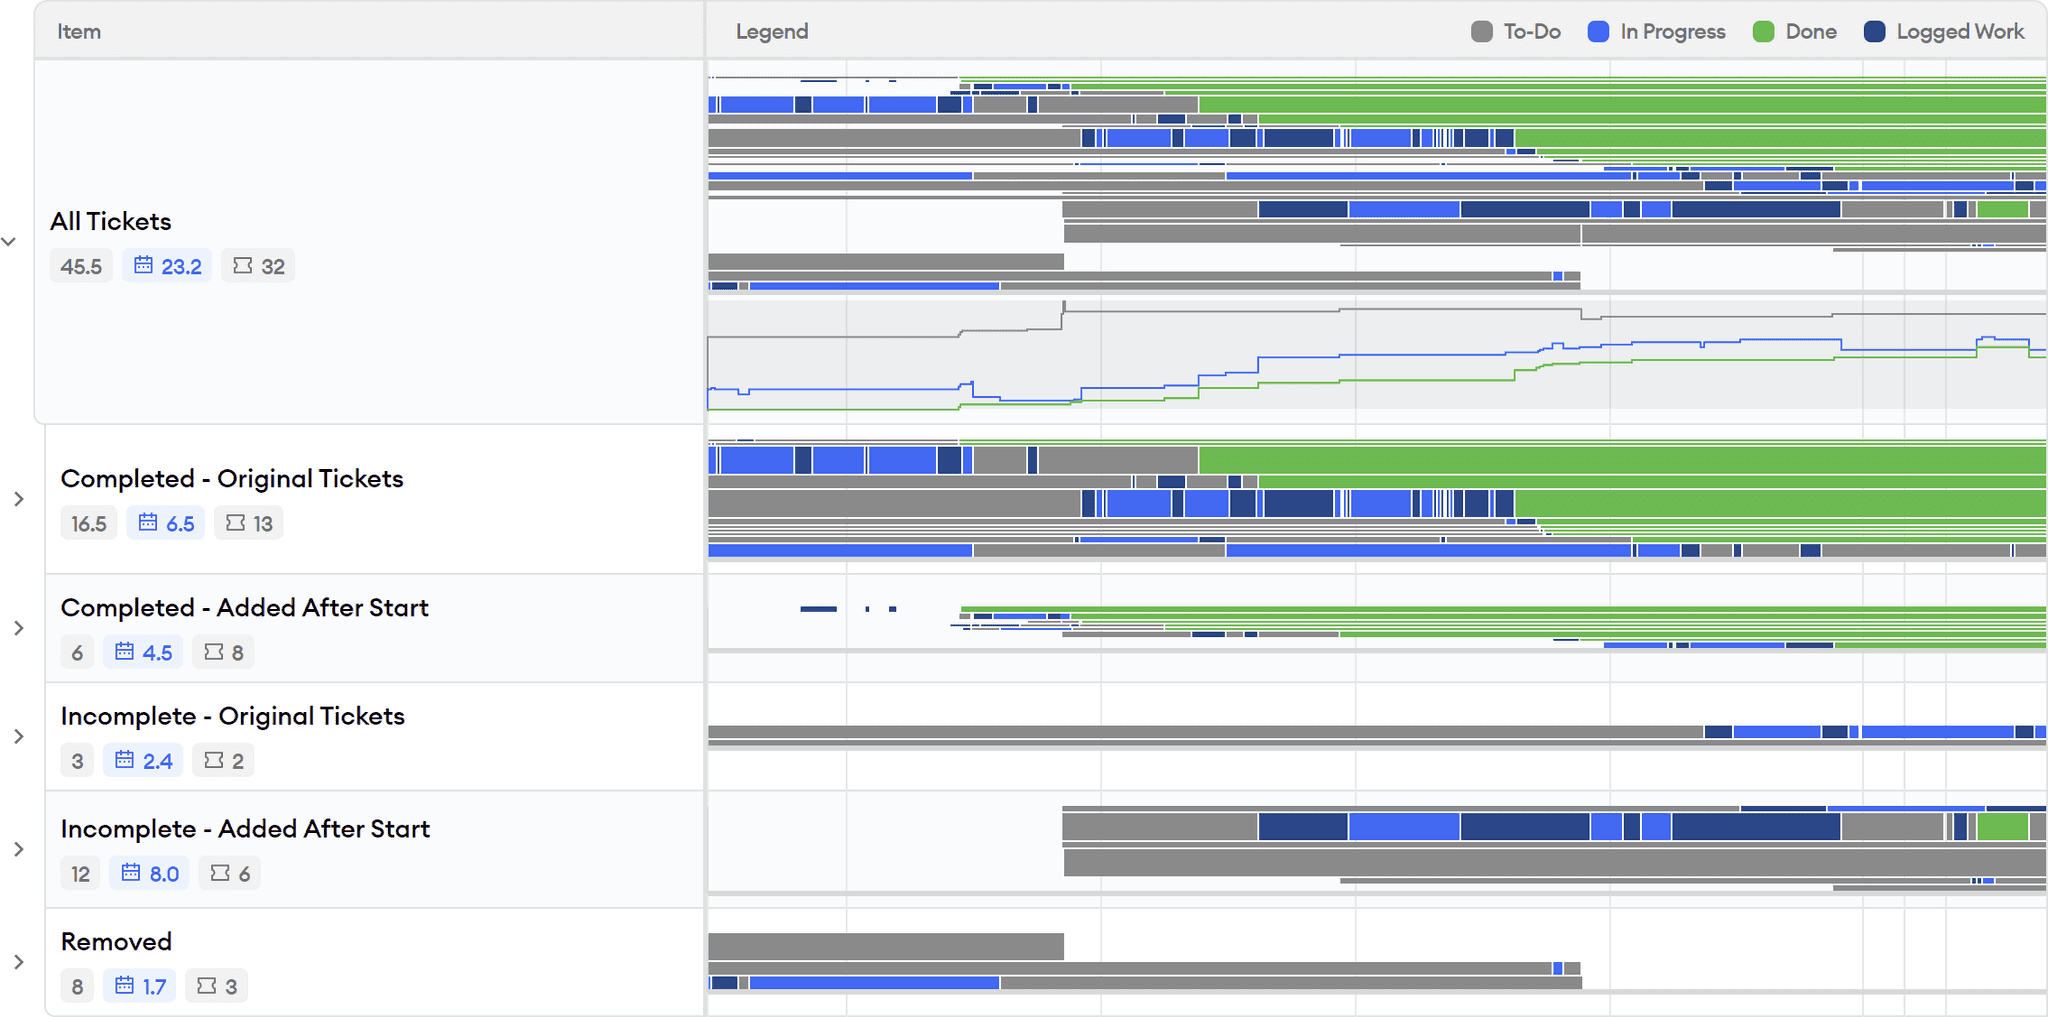
The previous sections in this report focused on the timeline of development activity, but the ticket flow section illustrates task burndown by issue status and estimate size, as shown in this screen shot:
Here, each of the bars represents one ticket, and they are sized according to their story point or original time estimate (defaulting to 1 story point if no estimate is set).
You can group the ticket flow in different ways, such as by status (e.g., completed, incomplete, added after start of the sprint) or assignee.
This section is helpful for diagnosing overall sprint issues that may show up in aggregate in the Sprint Best Practices report. For example, you can see exactly when tickets were added or removed during the sprint, how long they were in progress, and whether the overall burndown is roughly linear or work was held up at different points.
When to Use This Report
This report is designed to be used in a sprint retrospective. It has everything a team needs to assess the root cause of issues that arise during a particular sprint, and serves as a helpful dashboard during this meeting.
Additionally, the sprint insights report is the best place for people to check in during a stand-up or on an ad hoc basis to see how things are progressing toward sprint goals. Because it is scoped to an individual sprint and team, it also serves as a good dashboard for each person to view their recent activity.
Who Should Use This Report
Because the sprint insights report contains a high level of detail, it is unlikely to be useful for senior managers or people who do not participate in the team’s sprint ceremonies (e.g., sprint planning, stand-ups, retrospectives).
This report is helpful for product owners and scrum masters to assess overall sprint progress, but is also useful for individual participants in the sprint to see their own activity and how it tracks toward sprint goals.
How Not to Use This Report
As mentioned previously, managers outside the team should be very careful about looking at this report and drawing any conclusions without someone on the team to explain the context. There are many scenarios where something looks bad but has a benign explanation and isn’t a real problem, such as a large amount of non-coding time that was actually spent on an important task like reproducing a bug without making any code changes, or where someone was out-of-office but didn’t mark it on the calendar.
While the sprint insights report has a lot of information, it’s also important that teams not only look at this report. It is possible for sprints to look entirely healthy, but for the team to fail at providing value by having problems with quality, technical debt, or higher-level project planning.
The Bottom Line
The sprint insights report is minware’s nexus for teams to drill down and assess the root cause of issues that occur during a sprint. It provides full details from different angles about how people spent time and how tickets progressed.
Because it is scoped to an individual team and sprint, however, it doesn’t do as good of a job at showing long-term trends, which you can see better in the Project Cost Allocation, and Sprint Best Practices reports.
While the sprint insights report directly highlights a lot of potential issues, the Scorecard report more comprehensively covers all the best practices that teams should consider to better deliver high-quality software on time.
This article is the last in our walkthrough series. Please contact us if you’d like to learn more – we’d love to hear from you!
